

Aviator Round History Statistics: Reading the Panels
In short: Aviator's round history is a strip of past multipliers that forecasts nothing: across the thirty consecutive results we logged on , three ended at exactly 1.00x and the median was 2.22x.
The panels down the left of Aviator and along the top of it hold more numbers than the game itself, and not one of them tells you what the next round will do.
- Game:
- Aviator (a Spribe crash game)
- Type:
- Crash game
- RTP as published:
- 97% is the only return-to-player figure Spribe publishes, and it appears in exactly one place: the Return to Player (RTP) row on the studio's own game page.
- Max win:
- Not published by the developer.
Table of contents
- What the Statistics Panels Cover
- What the Round History Strip Holds
- Thirty Rounds We Logged
- Thirty Consecutive Aviator Rounds, Read from the History Panel
- What Live Bets Adds
- What the Top Tab Keeps
- The Three Top-Tab Views and What Each One Ranks
- Your Own History Sits Elsewhere
- Why None of It Predicts Anything
- Key Terms Used on This Page
- What Else Do Readers Ask
What the Statistics Panels Cover
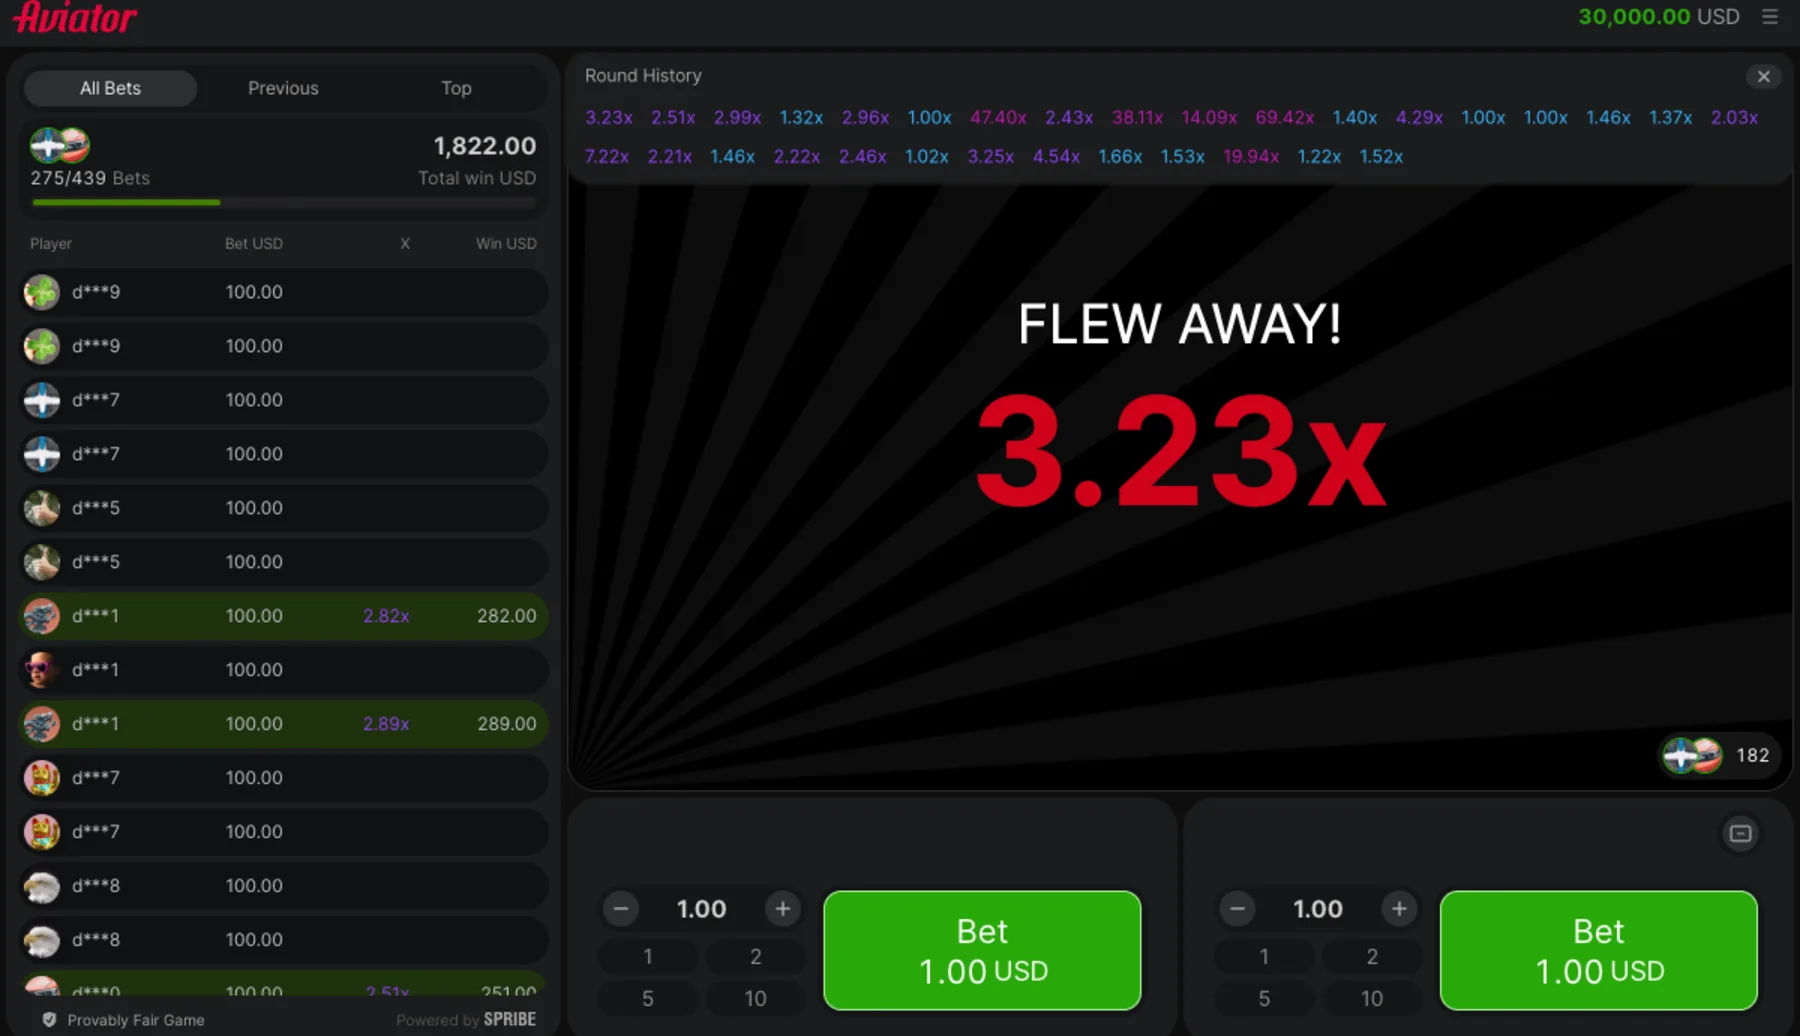
- Round History: the strip along the top of the board, expanding into a grid of past round multipliers
- Live Bets: the left-hand list of every bet in the current round, with stake, multiplier and win once a player leaves
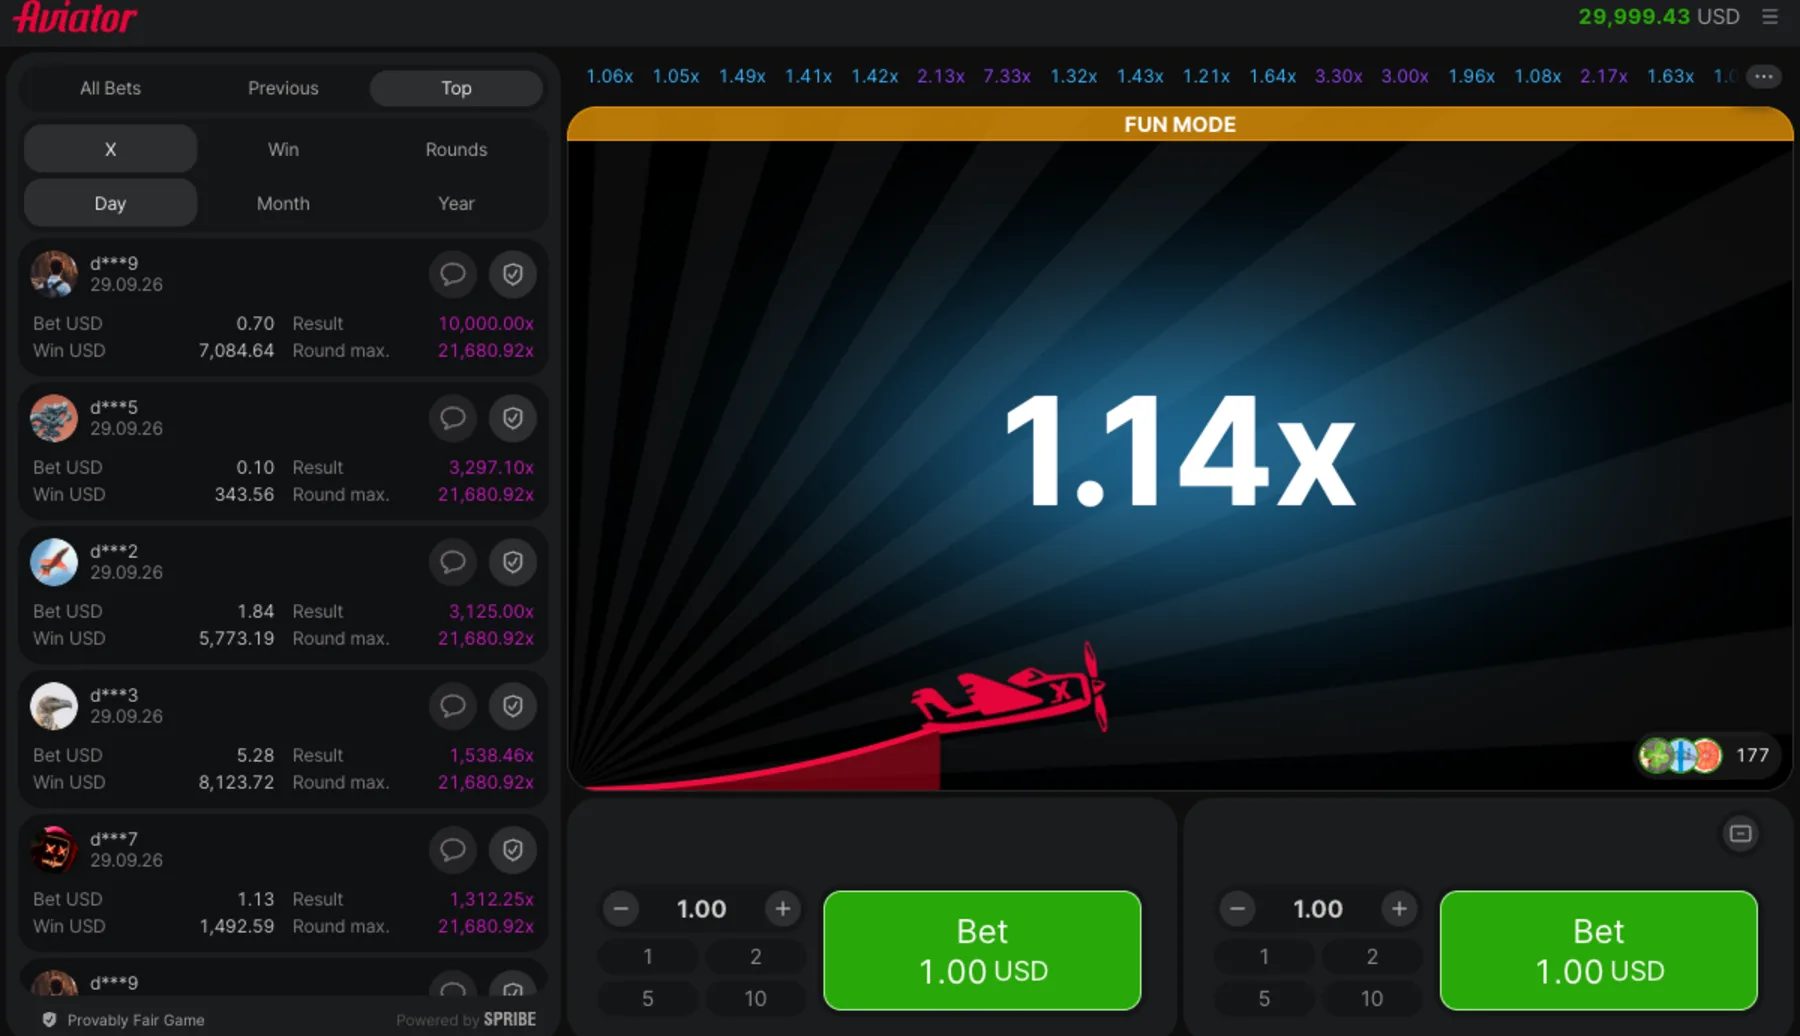
- Top: a leaderboard with X, Win and Rounds views, filtered by Day, Month or Year
- My Bet History: your own rounds, reached from the game menu, each row carrying a fairness icon
- What a row links to: the fairness record for that round, with the seeds and the hash behind the result
- Record line: Round max. 21,680.92x, repeated on every Top-tab row
- What none of them do: forecast the next round, which is settled before betting opens
What the Round History Strip Holds
A row of past multipliers, newest on the left, and that is all. Click any one of them and the fairness record for that round opens, which is the single genuinely useful thing the strip does. Expand it and the row becomes a grid; ours showed thirty results at once.
Colour is decoration, not data. The client tints higher multipliers differently, so a screen full of purple reads as a hot table even though the tint is only a threshold applied to a number.
Thirty Rounds We Logged
We expanded the panel at 18:16 on and copied every value out of it by hand.
Thirty Consecutive Aviator Rounds, Read from the History Panel
| Measure | Value |
|---|---|
| Rounds in the snapshot | 30 |
| Ended at exactly 1.00x | 3 |
| Ended below 1.5x | 10 |
| Ended below 2x | 13 |
| Ended below 3x | 21 |
| Median result | 2.22x |
| Highest in the run | 69.42x |
Figures current as of ; the operator's live terms prevail.
The shape matters here, not the individual figures. Two thirds of the run finished under 3x while one round climbed to 69.42x, and that lopsidedness is what a crash game's arithmetic produces. Thirty rounds is a snapshot, though, not a measurement. A different thirty would look different, and anyone calling this sample far too small to carry a conclusion would be right.
One cross-check we can run. The client publishes its own growth rule, floor(100 * e^(0.000083 * ms)) / 100, where ms counts how long the plane has been up. Push the snapshot through it and the 69.42x round works out at roughly 51 seconds of flight, the 19.94x round at about 36. Both match the pace of rounds we sat through, which is a small sanity check that the curve on screen is the curve in the code.
What Live Bets Adds
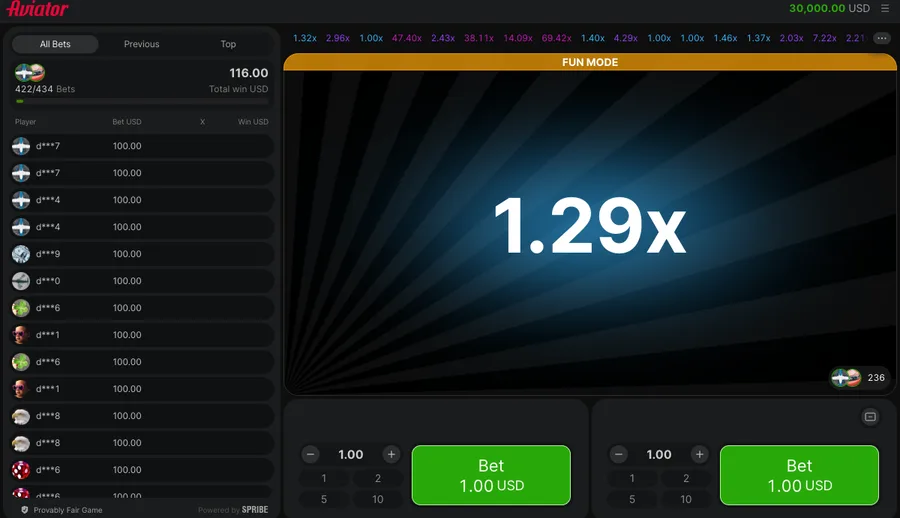
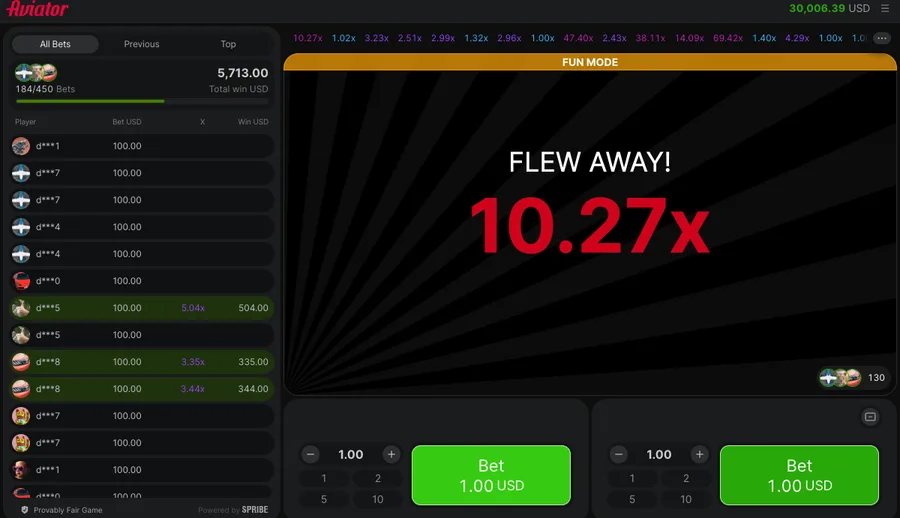
Every bet in the current round, as it happens. Other players' stakes appear immediately, and a multiplier and a win join the row the moment someone leaves. During the 3.62x round we screenshotted, two players had already closed at 3.35x and 3.44x while the plane was still climbing.
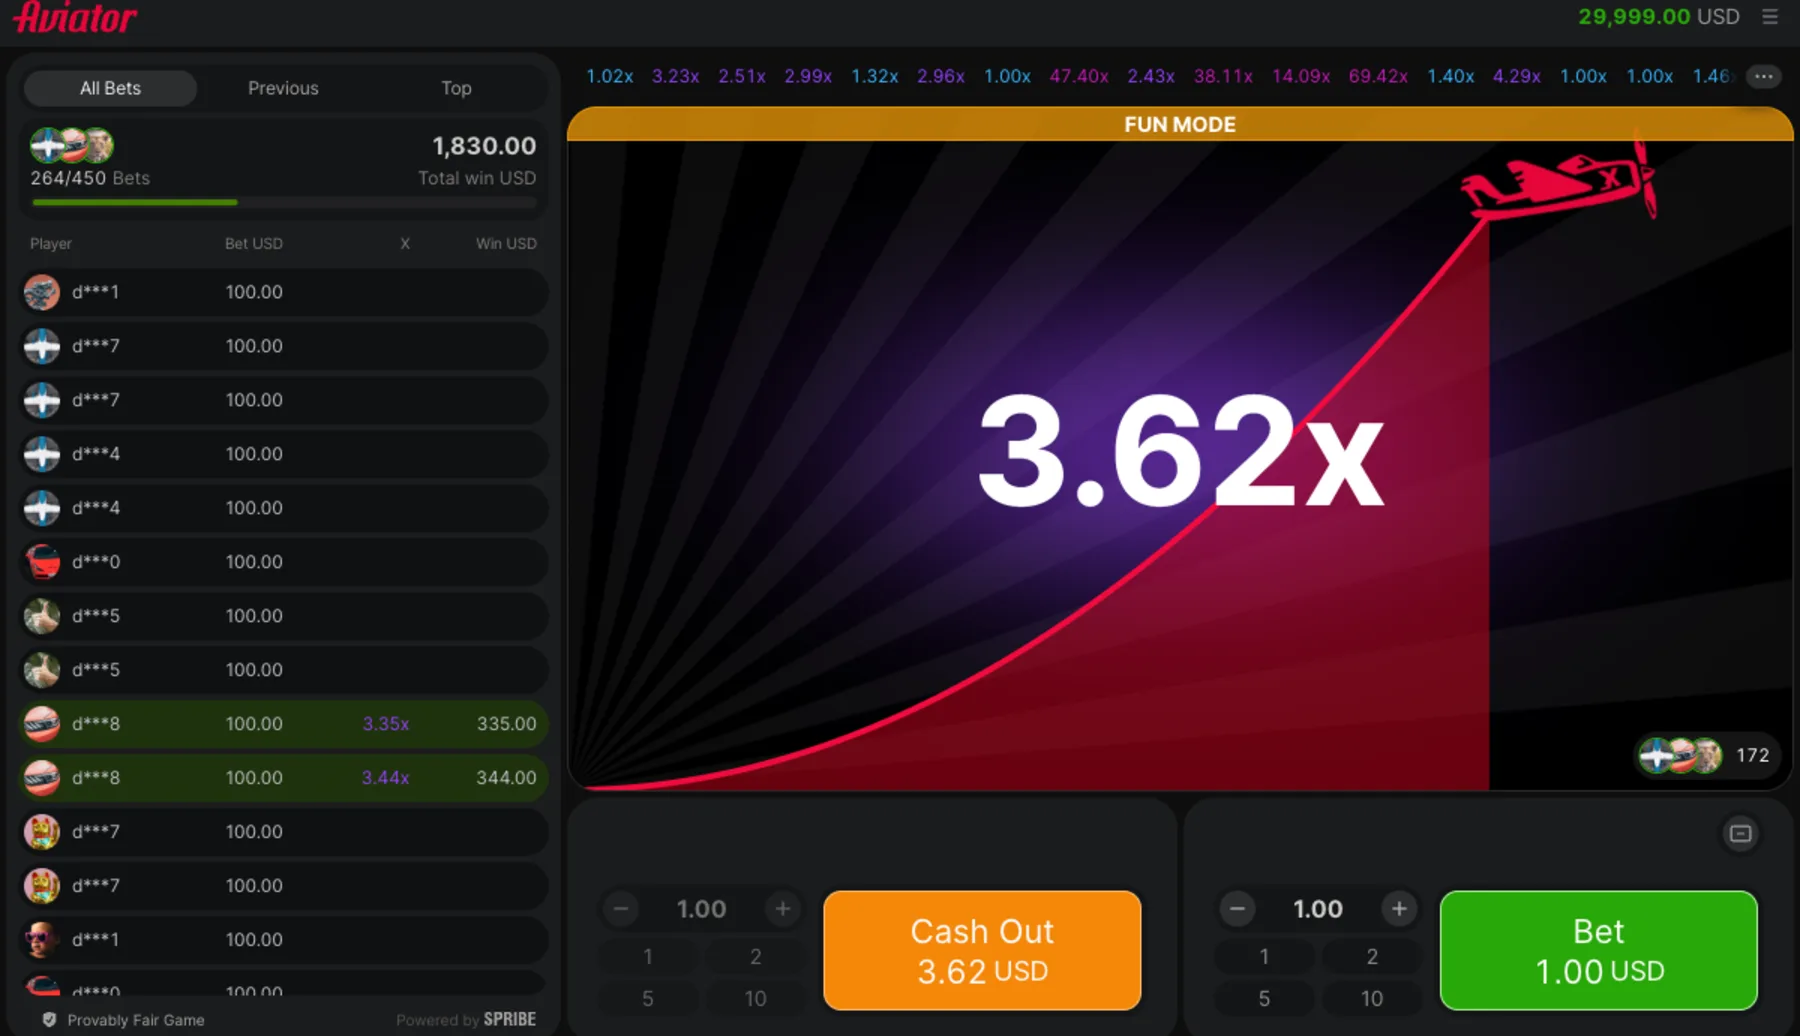
It is the most sociable panel and the least useful one. Watching someone else leave at 3.35x tells you what they chose, not what the round will do.
What the Top Tab Keeps
Records, filtered by Day, Month or Year, across three views.
The Three Top-Tab Views and What Each One Ranks
| View | What it ranks | Filters available |
|---|---|---|
| X | the highest round multipliers | Day, Month, Year |
| Win | the largest wins by amount | Day, Month, Year |
| Rounds | players by number of rounds played | Day, Month, Year |
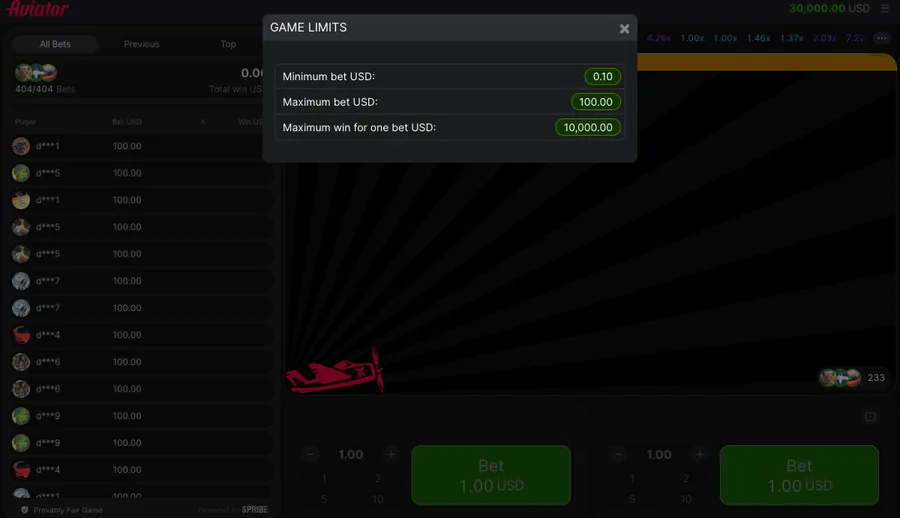
Every row also carries one shared figure, "Round max. 21,680.92x", which is the biggest round on the demo's books. One entry on the day board deserves flagging because we cannot explain it: the largest cash-out listed reads exactly 10,000.00x, on a 0.70 stake. Whether that is a ceiling the operator configured or simply where that player decided to leave, the screen stays silent, and we would rather leave it open. Our max-multiplier page sets out what is and is not published about ceilings.
Your Own History Sits Elsewhere
The public panels leave you out. MY BET HISTORY, in the game menu, is the only record of your own rounds, and we would trust it over written notes every time: it prints the date, the stake, the multiplier the round ended on, and a cash-out column that stays blank when you lost.
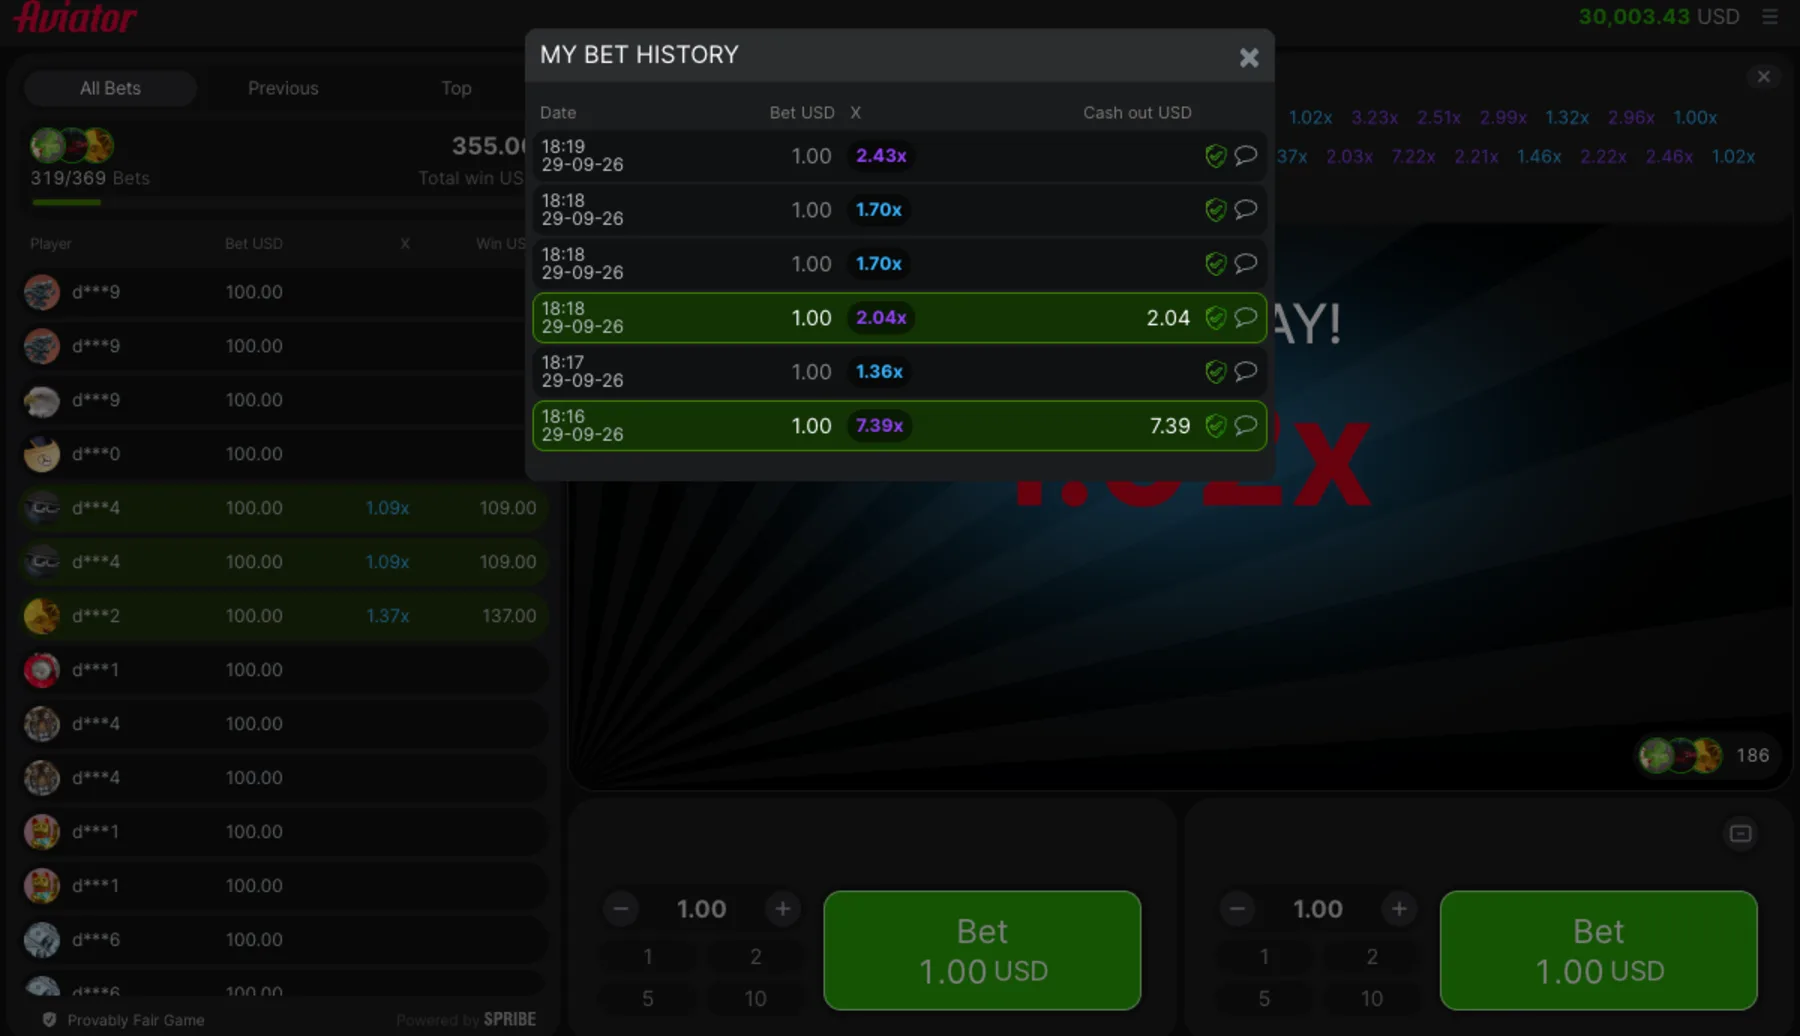
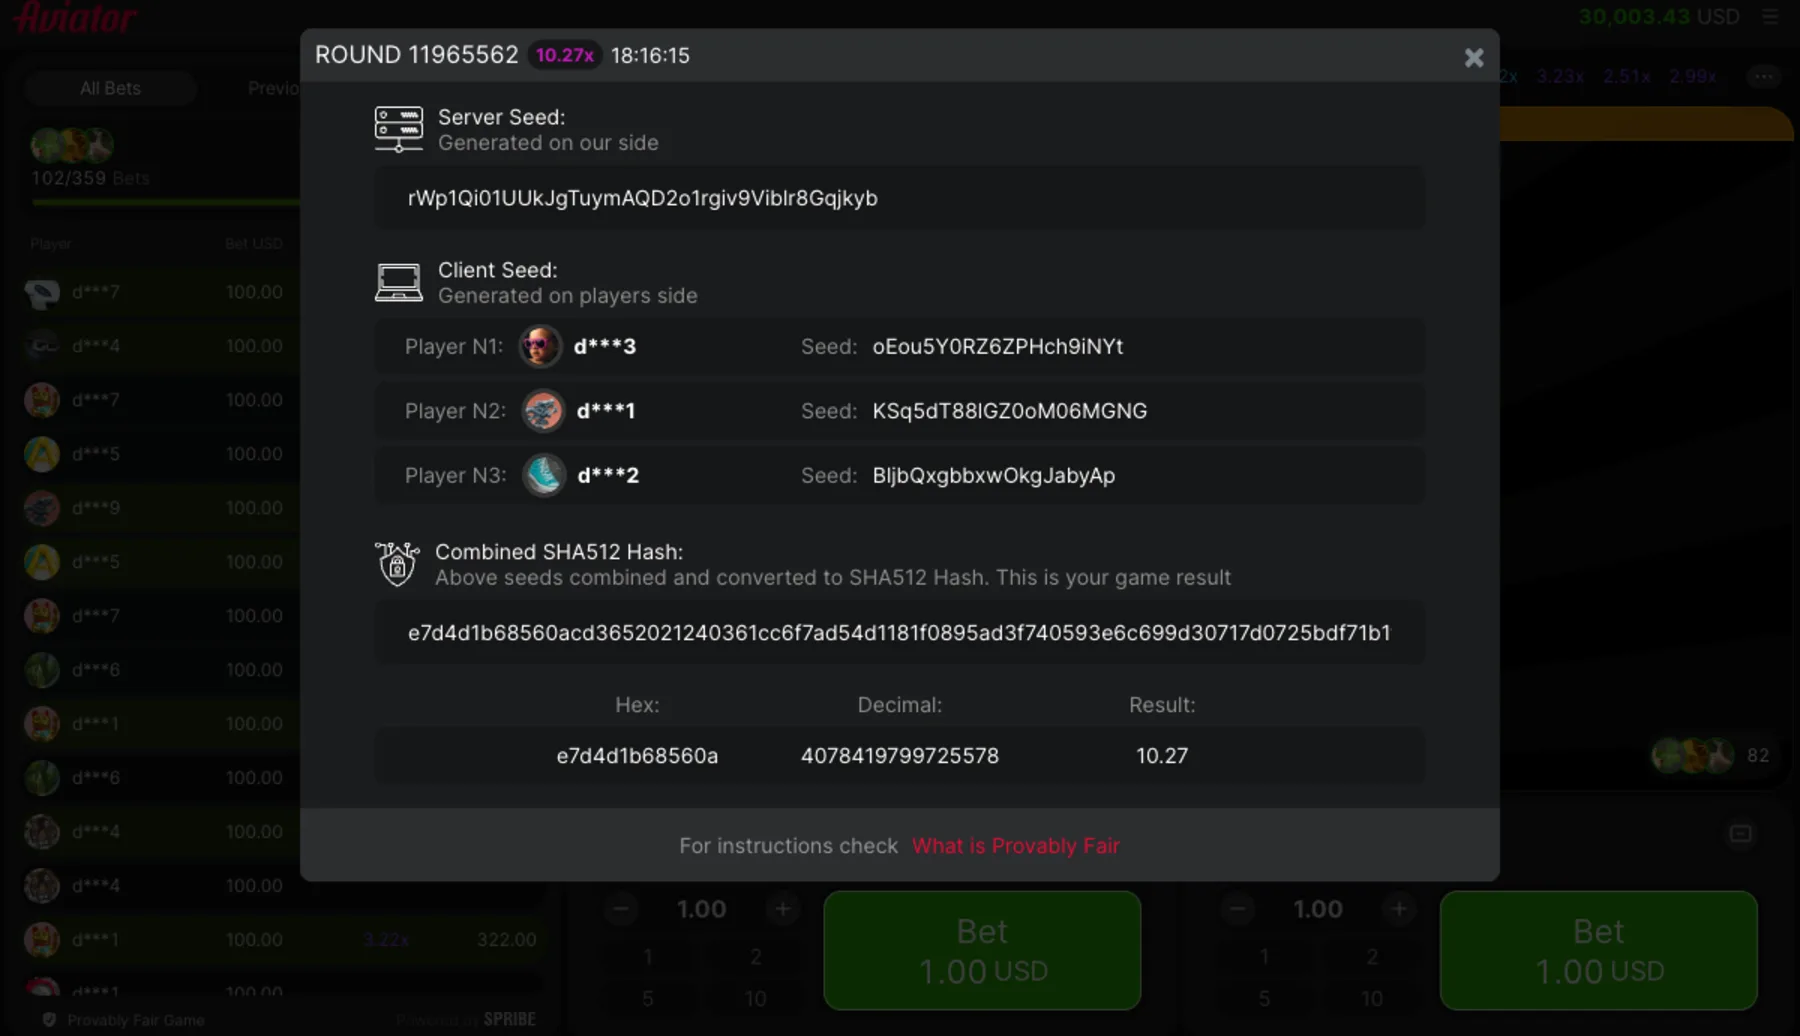
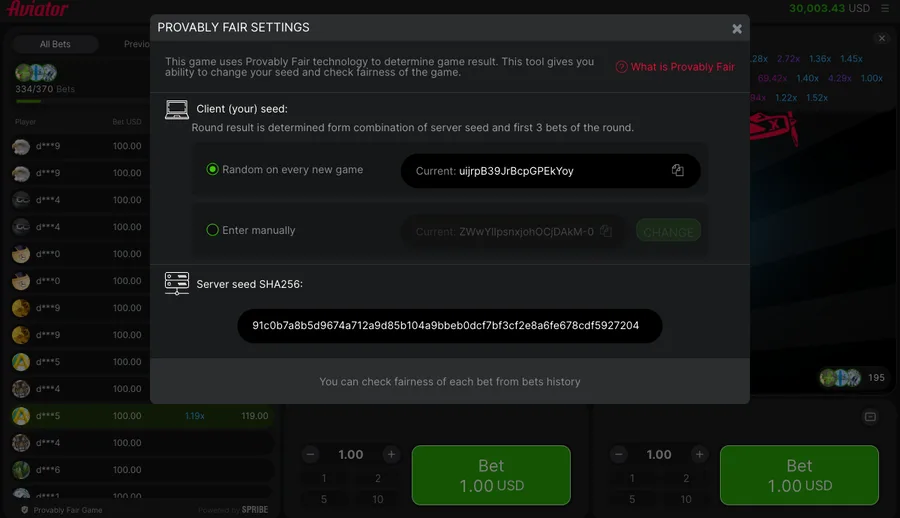
Each row carries a fairness icon. Click it and you get that round's server seed, the three client seeds, the combined hash and the result. We used exactly this route to reproduce three rounds by hand, and the arithmetic sits on our provably fair page.
Why None of It Predicts Anything
The result exists before betting opens. Aviator fixes each round from a hash of the operator's server seed and the client seeds of the first three bettors, so by the time a multiplier reaches the history strip, its successor has already been settled by numbers drawn independently of it. A run of five low rounds carries no debt into the sixth.
That is also why we do not recommend reading the strip as a signal, and why software sold to forecast the next round cannot work even in principle. Check Point Research reported in June 2026 that one such product was a clipboard hijacker, swapping copied wallet addresses for the attacker's, with over 1,250 downloads of the macOS build alone.
If you want a real use for these panels, use them to calibrate yourself: watch thirty rounds without betting and count how often the plane leaves before 1.5x.
Key Terms Used on This Page
- Round History
- The strip of past multipliers above the board; the panel we expanded held thirty results, three of them exactly 1.00x.
- Live Bets
- The left-hand list of stakes in the current round; ours showed cash-outs at 3.35x and 3.44x during a 3.62x round.
- Round max.
- The Top tab's record line, reading 21,680.92x on the demo's day board.
- Fairness record
- The per-round panel reached from any history row, printing the server seed, three client seeds and the SHA-512 hash behind the result.
Not sure yet? Try the free demo first and learn the round with play money before any deposit.
Try the free demo first →Deposits and identity checks stay on the operator's own secure site.
Related Reading on This Game
More on this game, from the same section first:
 Guides
Round walkthrough
Cash out above 1.00x or lose
 Guides
Free Demo
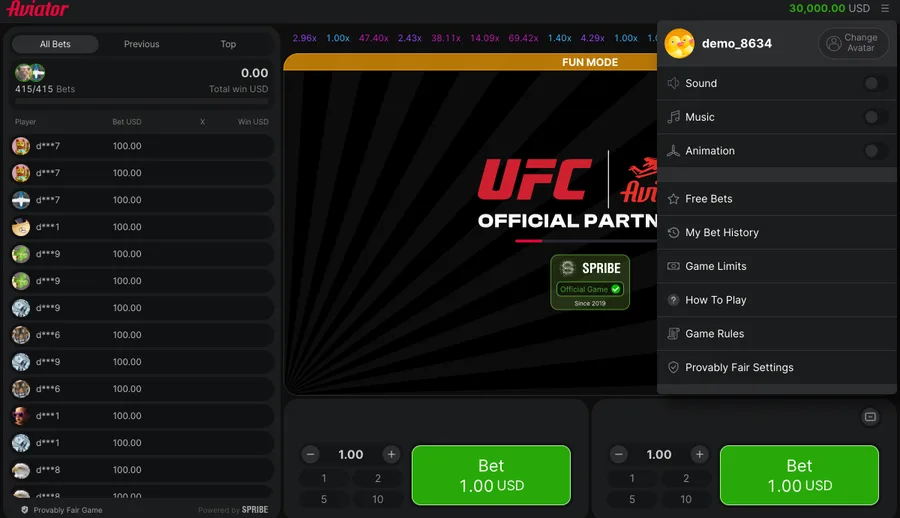
30,000 USD play money, no account
 Guides
Auto cash out rule
Auto exit range 1.01 to 100
 Guides
Cash-Out Plans
Chance of reaching m is 0.97/m
 Guides
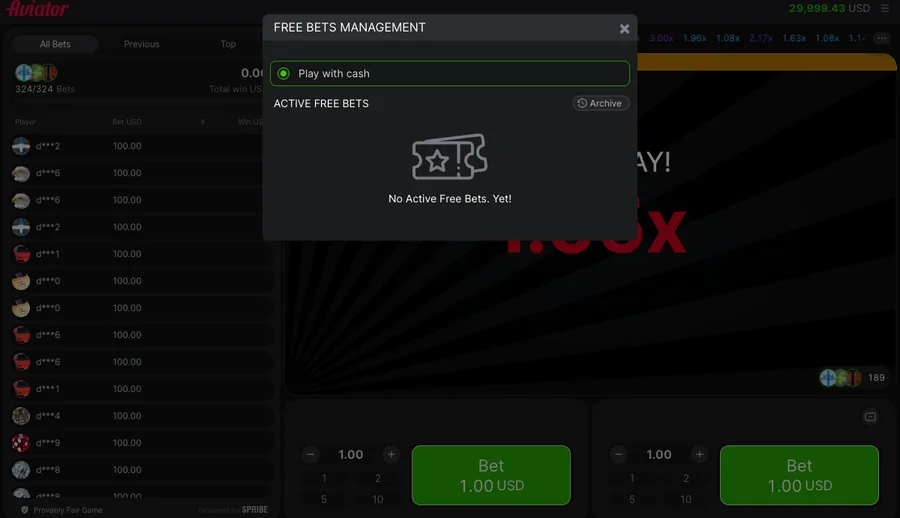
Free bets and Rain
0 free bets across 10 rounds
 Reference
Provably Fair Explained
3 rounds reproduced from published seeds
 Casinos
4rabet Limits and Bonus
Stake floor INR 8.5, wagering x25
What Else Do Readers Ask?
Most of these arrived from readers trying to turn the history strip into a system. The answers come from the panels themselves, read in Spribe's official demo on .
Can results be saved or downloaded?
No. No download, copy or archive control exists in the client, so anything worth keeping has to be written down while it is still on screen.
What does a 1.00x entry mean?
The plane left at once and every bet in that round lost. Three of our thirty logged results were exactly 1.00x.
What happens to the sequence when you switch game rooms?
Each room draws on its own seeds, and the client warns that switching restarts the game. Whether the visible sequence carries across rooms, we did not test.
Can the next result be worked out from earlier ones?
No. Each result comes from seeds drawn fresh for that round, so a run of low numbers carries no information about the one that follows.
Where do the multiplier colours come from?
Colour tracks the size of the value, as far as we could tell from a full screen of results. No legend in the client confirms the bands.
Is the same view available without betting?
Yes. Everything described here sits on screen before a stake is placed, and the demo opens without an account, so watching costs nothing.
How did we check these figures?
We copied every value by hand at a noted time, then tested them against the growth curve the client publishes, so nothing here rests on memory.